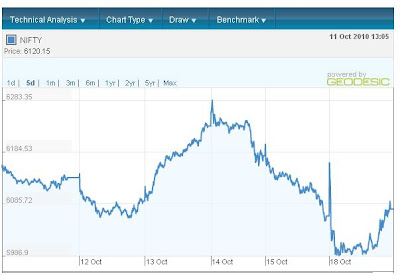
 Target Achieved in NIFTY Fut Buy Call given @ 6082.90 or 6060 - 6100 on 15 Oct 2010. NIFTY Fut crossed the target which was 6135 and made the high level 6136 and closed today @ 6133. Today the market came from red signal to green signal in closing hours. The low was 6007.60. This
  signal shows NIFTY fut is closing above 6000 by this expiry so carry the short position in NIFTY 6000 Put @ Rs.42.70 (Current CMP as on 18 Oct 2010 is Rs. 32.36) given on 11 Oct 2010.
NIFTY 5 days Movement
Major Support & Resistance of NIFTY as Expiry Point of View
Resistance :- 6245, 6414.05, 6544
Support :- 5946, 5816.05, 5647
Balance Point or Break even Point 6115.05 as expiry point of view
Support & Resistance of NIFTY as trading Point of View
Resistance :- 6176.80, 6220.60, 6305.20
Support :- 6048.40, 5963.80, 5920
Balance Point or Break even Point 6092.20 as trading point of view
Profit :- 6135 - 6060 = +75 points per lot (Rs.3750 (50*75 points) per lot )

No comments:
Post a Comment